
If you missed our first post in this series, read it now.
Warehouse Experiment - UPDATE
A little over a year ago, we shared a post on the ISC Barrels blog about a warehouse experiment we started with Willett Distillery back in 2019. In that post, we discussed the 12-month chemical data for composite samples of floors one through five and conveyed our conclusions from the information we obtained. Click here to revisit the original post.
It is hard to believe but this experiment will be coming to an end this September. Being that the four-year summation is just around the corner, I wanted to provide a brief update using the 36-month chemical data we obtained from the samples; if only to show you something we did different this year with the sampling.
First, let’s review the 12-month results for each floor. The data is displayed below in Figure 1.
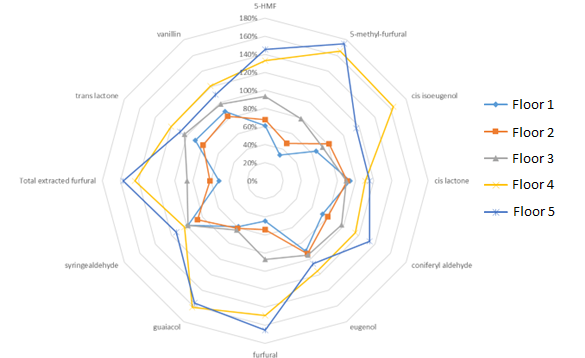
Figure 1. 12-month Chemical Data
If we compare these results to that of the 36-month samples (displayed below in Figure 2), we can see a couple of things.
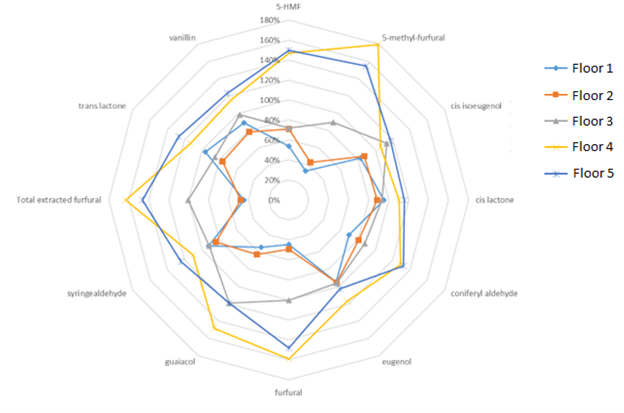
Figure 2. 36-month Chemical Data
First, let’s note that the flavor profiles for each respective floor remained relatively unchanged between 12 and 36 months. When utilizing non-toasted barrels, this type of result is fairly consistent.
Second, when we summed up concentrations for all key flavor congeners at 36 months, we found that Floor 1 was the least extracted; followed by Floor 2, Floor 3, all the way up to Floor 5. This is also consistent with the data obtained from the 12-month samples. We can make some additional conclusions, but I will save that for the experiment summary after the 48-month data is collected.
We made things more interesting by taking the 36-month samples and creating one composite sample of all five floors. First, we composited the six barrels from each floor to get our individual composite sample for each floor. We then took a 50mL from each of the floor composites and blended them to create an overall composite for all five floors. The data is displayed in Table 1 below.
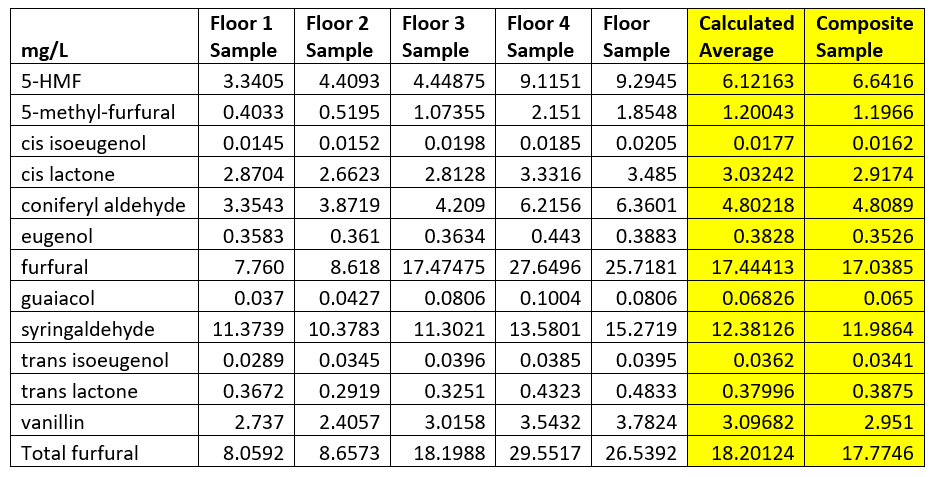
Table 1. Concentration Comparisons to Composite Sample
The nice thing that occurred here is that for every compound measured, the calculated average concentration across all five floors differed from our overall composite sample concentration by an average of less than 1%. Some might say this a stretch to call this interesting or unexpected, but I found the results to be quite satisfying. Maturation chemistry is very complex and more often than not, you run across unexpected results when conducting different experiments. Sometimes this is due to instrumentation error; sometimes there might be an error in compositing; and sometimes the results are correct but totally unexpected!
The result from this little test doesn’t represent any kind of unknown phenomena or strange outcome. It was just a nice occurrence where things seem to uncomplicate themselves and behave exactly as you had expected. And in my job, that is something to shine a little light on. Hope you enjoyed it!
Cheers!
Andrew Wiehebrink
