Trial 5: Barrel Warehousing- Effects on Maturation in a Multi-Story Rick House After 12 Months of Aging
Andrew Wiehebrink, Director of Spirit Research and Innovation
Introduction
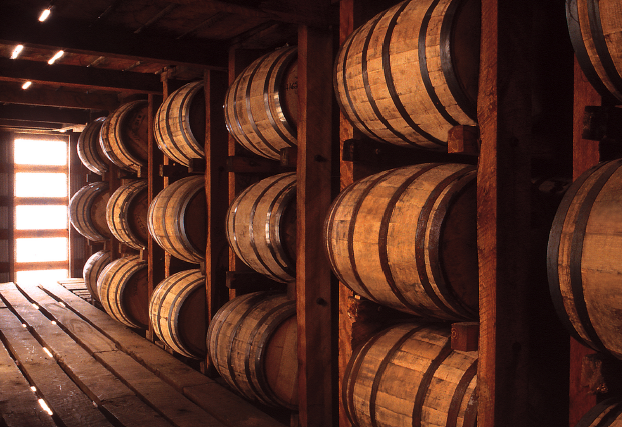
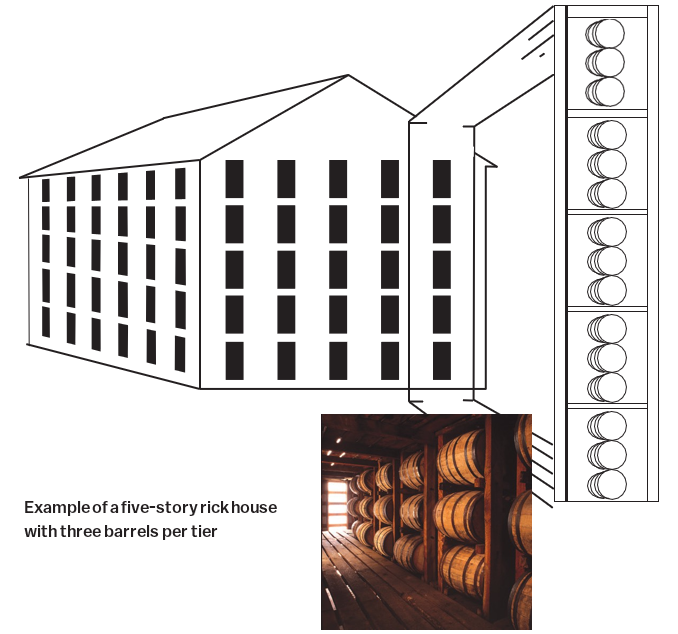
The most common style of warehousing seen in the production of American whiskeys is called traditional rick storage. In this type of storage, barrels are stored in tall racks known as ricks. One rick is typically between ten to twenty-five barrels deep and can reach up to nine stories, with three tiers of barrels on each story. Each level has its own micro-climate and experiences different temperature and humidity fluctuations that are unique to that level. The difference in temperature and humidity can have a significant effect on the flavor development in barrel-aged spirits.
Objective
The purpose of this experiment is to examine how temperature and humidity differences on each level in a five-story rick house will affect the flavor development in new make bourbon whiskey.
Methods
Base Liquid
Variety: New make bourbon distillate
Mash Bill: 72% corn/13% rye/15% malted barley
Entry Proof: 125 proof/62.5% ABV
Trial Execution
Entry Date: October 2019
Primary Maturation Period: 12 months
Warehouse Location: Bardstown, KY
The Trial
New make bourbon distillate filled in the following barrel type:
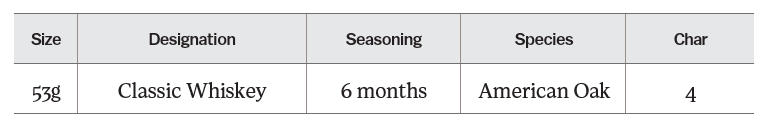
Six identical experimental barrels were placed on each level of the warehouse. All barrels on each floor level were also stored in the same rick and tier.
To gather data on both temperature and humidity, sensors were placed on each level of the warehouse in the rick in which the barrels were stored.
Samples were taken from each barrel at 12 months then analyzed using Gas Chromatography-Mass Spectrometry (GCMS). All compound concentrations are displayed in graphs as a percent of the average concentration across all barrels in the experiment or their corresponding units in the bar charts.
Results and Discussion
The temperature and humidity data for the first year of maturation is shown in Table 5.1.
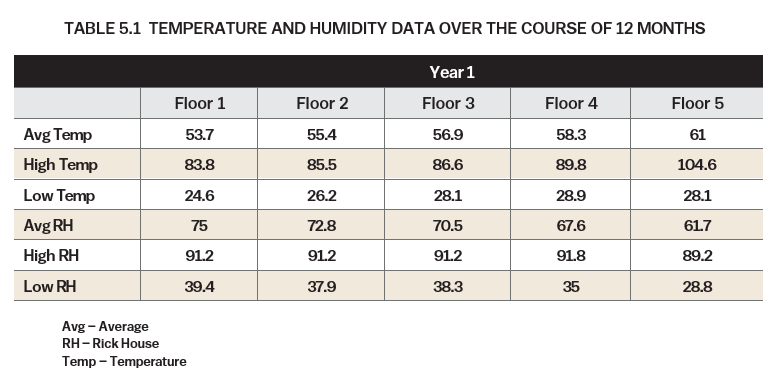
To facilitate evaluation, Figures 5.1 and 5.2 display the temperature and humidity data from Table 5.1 in graphical form.
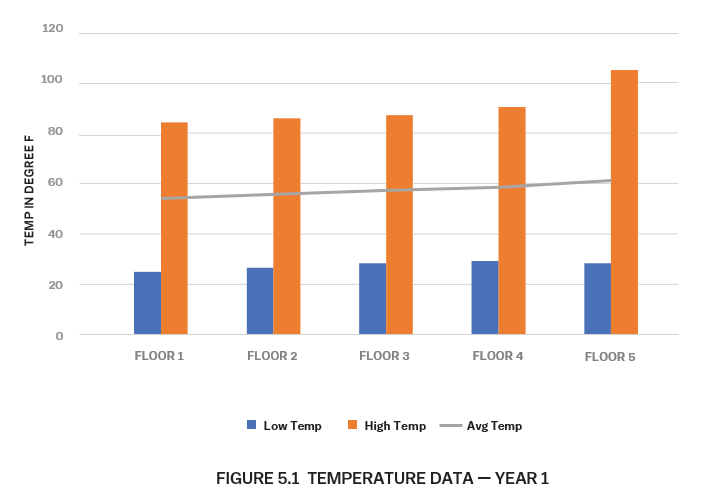
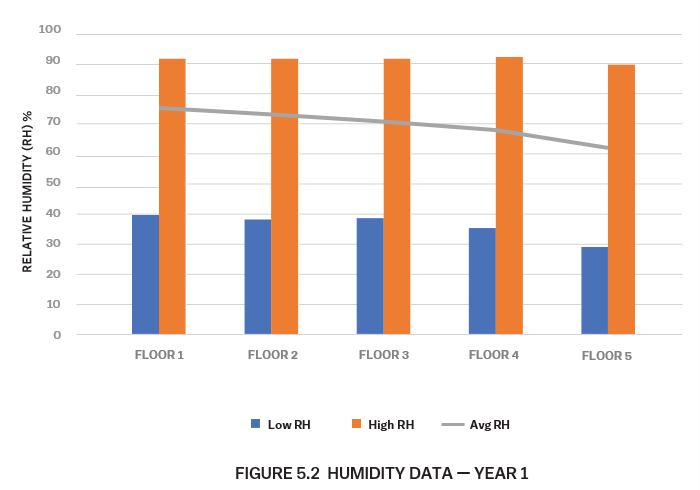
The data provides evidence for two trends as we ascend each level in the rick house: average temperature gets higher and average humidity gets lower. However, the recorded values differed only slightly between each floor level with the exception of Floor 5 – on this level, data demonstrates a higher jump in average temperature, and the highest temperature recorded was elevated compared to the readings from Floors 1-4. This data supports the tendency of top floors in warehouses to experience more swing due to less insulation and increased solar contact.
Next, Figure 5.3 shows the chemical analysis respective to each floor.
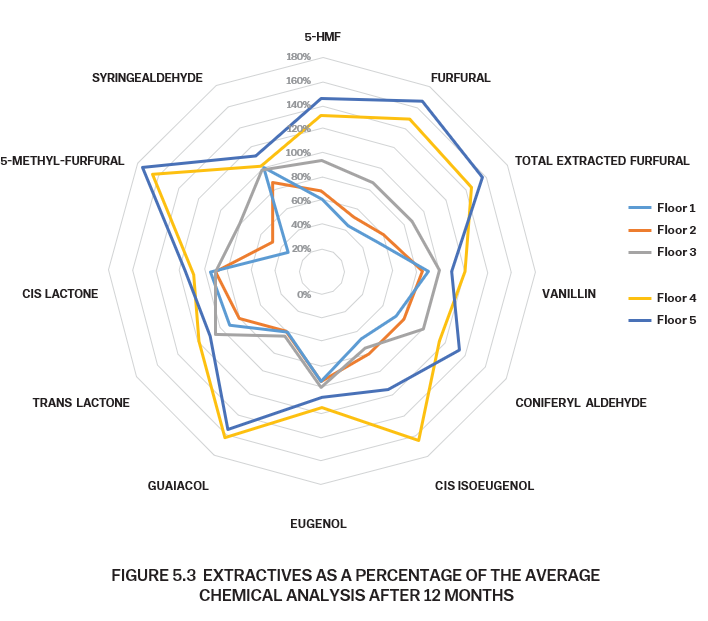
The extraction curves seem to be proportional to the average temperature values with respect to Floors 1 through 3, only showing a slight increase in extraction with each ascending level. Meanwhile Floors 4 and 5 show a significant boost in extractives, which does not necessarily correlate with the increase observed in temperature values.
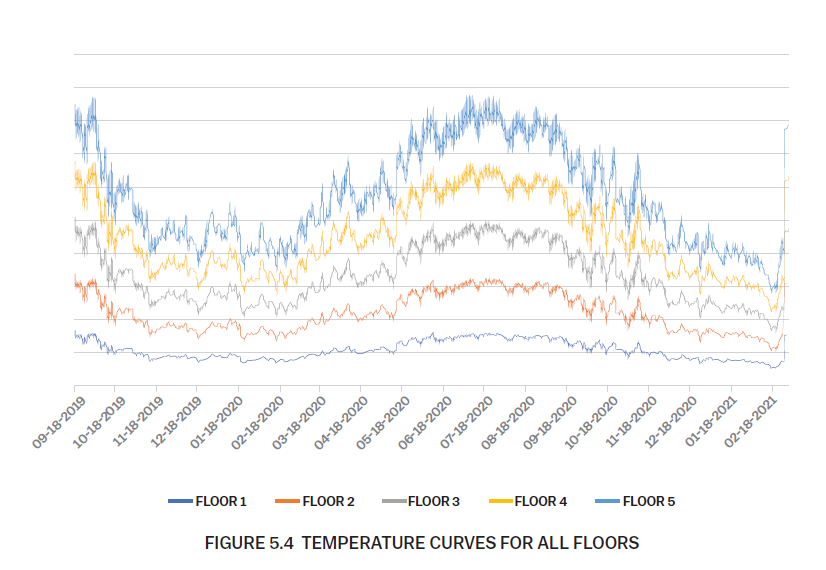
As a next step to investigate this further, temperature curves were examined for each floor. This data is presented in Figure 5.4. Please note the y-axis is not representative of the temperature value. Figure 5.4 is designed to show a visual comparison of each floor using frequency and amplitude to showcase change in temperature values.
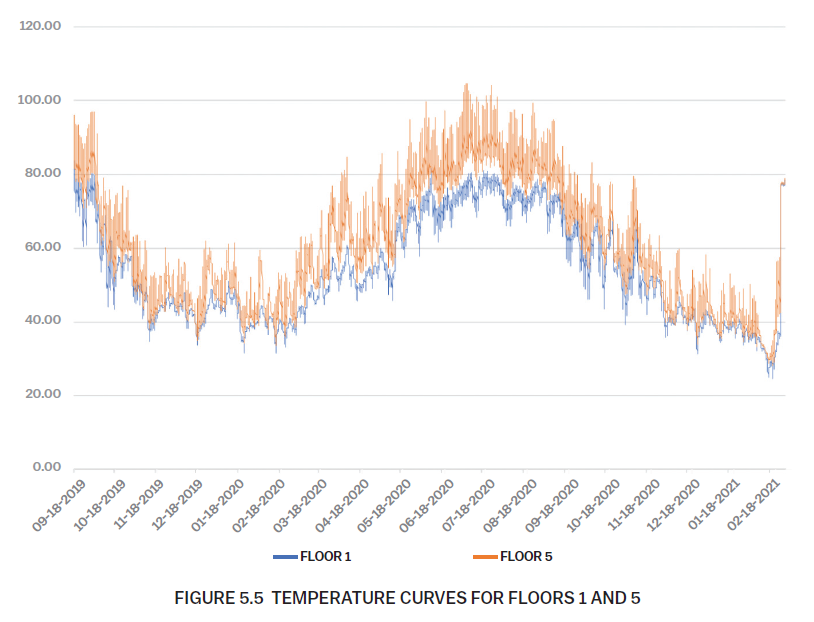
Results show the amplitude for each curve and the frequency, most notably in the summer months, seem to correlate with the extraction percentages more so than the temperature values for each floor. This indicates the temperature fluctuation could have more influence on extraction than the actual temperature value. Figure 5.5 isolates Floors 1 and 5 to better show the differences in temperature fluctuations over the same time period. Temperature patterns are identical, but amplitude and frequency increase with each ascending floor.
Conclusions
Several patterns were identified in data collected from this experiment confirming the influence of micro-climate in traditional rick house storage.
With each ascending level in the warehouse, average temperature value increased and average humidity decreased. Temperature swing also increased with each ascending level. These patterns are attributed to the top floors of warehouses having less insulation and increased solar contact, allowing for greater temperature fluctuation through the seasons.
Analysis also suggested that while temperature does influence extractive concentration and extraction rate, the temperature swing has the most significant effect on extraction of oak components during barrel aging.
Books are available through your account manager.